What Is the Difference Between Fundamental and Technical Analysis?
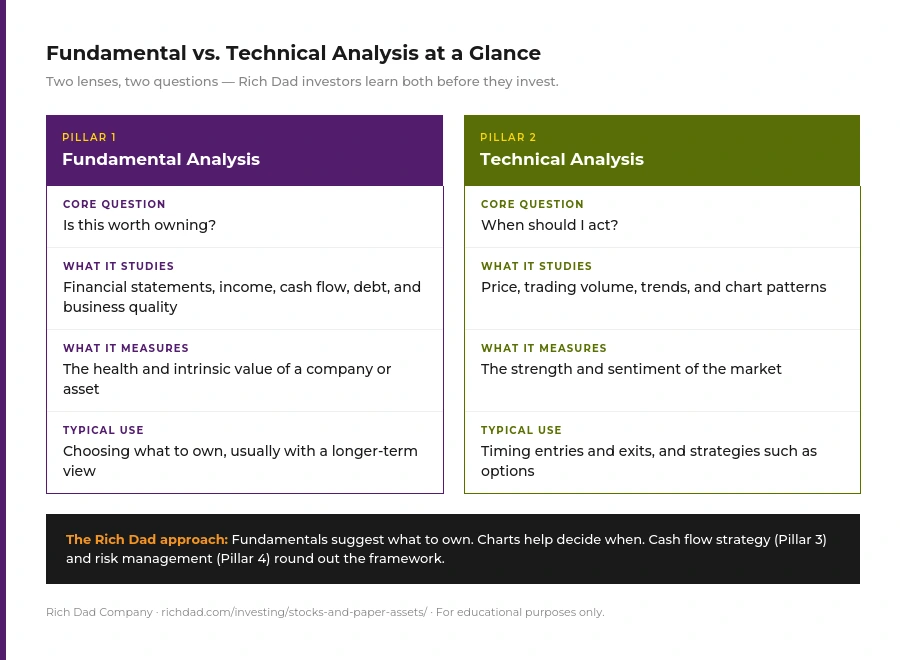
The difference comes down to the question each method asks. Fundamental analysis asks whether a company or asset is worth owning, based on its financial health and underlying value. Technical analysis asks when to act, based on price movement, trading volume, and market trends. One studies the business. The other studies the market.

Fundamental analysts care less about today’s stock price than about what the company is actually worth. Technical analysts care less about the company’s financial statements than about what the price chart shows buyers and sellers doing. Neither method tells you the future. Each gives you a different kind of evidence.
What Is Fundamental Analysis? The Financial Checkup
When you visit a doctor, she measures your vital signs to learn whether you are healthy or whether something needs a closer look. Assets have vital signs too. Fundamental analysis is the process of reading those signs to judge the health of a person, a company, or even a sovereign nation.
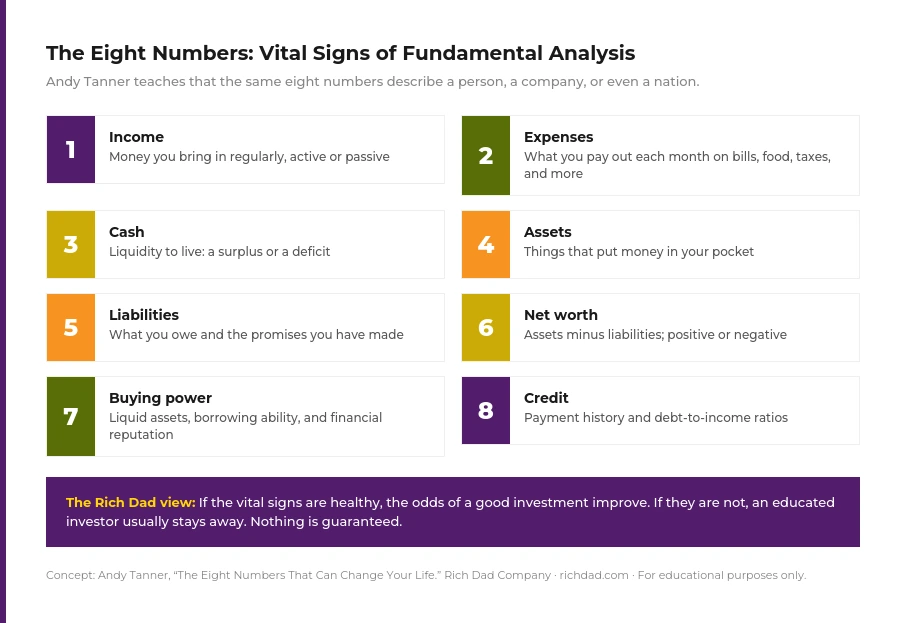
Andy Tanner calls these vital signs “The Eight Numbers That Can Change Your Life”: income, expenses, cash, assets, liabilities, net worth, buying power, and credit. The same eight numbers describe a household and a business, which is why financial education in one carries over to the other.
What fundamental analysis is used for
Investors who use fundamental analysis review a company’s financial statements to estimate its intrinsic value, then compare that value with the price the market is charging. The goal is to find companies that are financially sound but perhaps undervalued, and to avoid those whose vital signs look weak. It is closer to how a business buyer thinks than how a stock watcher thinks. What does the company earn? What does it owe? Does it generate cash? Is the debt manageable?
Reading financial statements is a skill, and it takes financial education to spot the trends and warning signs inside them. That is why Rich Dad encourages investors to learn the skill themselves rather than delegate the decision to someone else.
What Is Technical Analysis? Reading the Market’s Behavior
Technical analysis shifts the focus from the company to the market. Technical analysts study price and trading volume, looking for uptrends, downtrends, and sideways trends that suggest where a stock, or the market as a whole, may be heading. The toolkit includes price charts, moving averages, support and resistance levels, and momentum indicators. Rich Dad’s guide to reading stock charts covers the five chart types and the first signals worth learning, and the candlestick chart patterns guide goes a level deeper.
Where fundamental analysis looks at the health of an asset, technical analysis looks at the strength and mood of the market. Robert Kiyosaki’s rich dad described a well-trained technical investor as someone who invests on the emotions of the market while carrying insurance against catastrophic loss. That emphasis on market emotion is why technical analysis is useful for timing, and for advanced strategies such as options.
Does technical analysis work?
The honest answer is that the evidence is mixed, which is one reason Rich Dad pairs technical analysis with risk management. In a widely cited Journal of Finance study, researchers from MIT and Yale applied an automated pattern-recognition method to U.S. stocks from 1962 to 1996 and found that several technical indicators provided incremental information and may have some practical value. They also named a core obstacle: technical patterns are subjective, and shapes on a chart are often in the eye of the beholder.
A separate study of Dutch retail investors from 2000 to 2006 found that technical analysis users underperformed non-users, with the weakest results among frequent options traders. Taken together, the findings support what Rich Dad teaches: charts are a tool that takes training, discipline, and a plan to limit losses. They are not a shortcut.
Fundamental vs. Technical Analysis: Which Is Better?
Neither is better in every situation. They answer different questions, and the right balance depends on your goals, your time horizon, and how much you have studied. Schwab notes that how and when to use each can be a matter of personal style. Fundamental analysis has traditionally supported longer-term decisions built on earnings and valuation, while technical analysis is more often used to time entries and exits. In short, fundamentals suggest what to own, and charts help decide when.
Investors are divided on how much weight to give charts. In a 2019 AAII reader poll with 1,565 votes, 36% said they use basic technical analysis, such as charts and simple indicators like moving averages, and a high share said they use none at all.
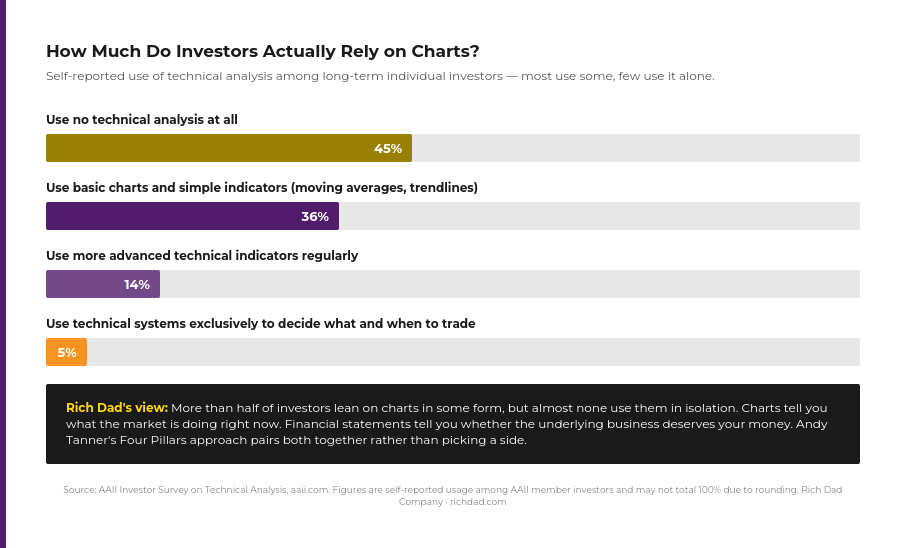
Using only one lens leaves blind spots. A great company can sit in a long downtrend, and a mediocre company can spike on hype with nothing underneath it. Rich Dad takes the combined approach: fundamental analysis to find a business worth owning, and technical analysis to time the decision.
Why Rich Dad Teaches Both Before You Invest
For most people, knowledge of paper assets stops at the mutual funds inside a 401(k). That arrangement asks you to trust decisions you do not understand, and the data suggests the trust is not automatically safe. The S&P SPIVA scorecard found that 79% of actively managed large-cap U.S. equity funds underperformed the S&P 500 in 2025, and over the 20 years ending December 2025, 92.89% did.

The scorecard measures professional fund managers against an index. It does not prove that individual investors will do better, and Rich Dad does not suggest anyone can skip the learning. The point is narrower: delegation is not the same as safety. What is riskier, blindly trusting funds you do not understand, or taking the time to learn how to analyze what you own? For a deeper look at why Andy Tanner calls the 401(k) a problem, read his book 401(k)aos.
How Fundamental and Technical Analysis Fit Into the Four Pillars
Andy Tanner teaches four pillars of investing: fundamental analysis, technical analysis, cash flow positioning, and risk management. Fundamental analysis identifies what is worth owning. Technical analysis helps decide when. Cash flow strategies, including options approaches such as covered calls, create income along the way. Risk management, meaning exit plans, position sizing, and protection, keeps one wrong decision from becoming a catastrophic one.
The first two pillars are the foundation Rich Dad encourages every new investor to study and master before entering the markets. Andy Tanner teaches the complete framework in The Four Pillars of Investing course, and the Stocks and Paper Assets hub collects Rich Dad’s stock market education in one place. For the broader skill of evaluating any asset class, see Rich Dad’s guide to finding good investments.
How to Start Learning Fundamental and Technical Analysis
You do not need to quit your job or master every indicator to begin. A simple starting sequence:
- Run the eight numbers on your own finances first. Calculate your income, expenses, cash, assets, liabilities, net worth, buying power, and credit. The same habits apply when you read a company.
- Study one company you already understand. Pick a business you use as a customer and read its financial statements for income, debt, and cash flow.
- Open a simple line chart of the same company. Decide whether the trend is up, down, or sideways, then add trading volume. The stock chart guide shows how.
- Practice before risking real money. Record hypothetical decisions, then compare them with what the market actually did.
- Write your exit plan before you buy. Decide what would prove you wrong and how much you can afford to lose.
For structured training, explore Rich Dad’s courses.
The Bottom Line
Fundamental analysis and technical analysis are not rivals. One tells you what a business is worth, and the other tells you what the market is doing with it. Rich Dad investors learn both, add cash flow strategy and risk management, and treat financial education as the investment that makes every other investment safer. Today is a good day to start investing in your own education.

FAQs
Fundamental analysis evaluates a company’s financial health and intrinsic value to decide what is worth owning. Technical analysis studies price and trading volume to judge market trends and decide when to act.
Neither is better in every situation. Fundamental analysis is generally used for longer-term decisions about what to own, and technical analysis is generally used for timing. Rich Dad investors learn both and combine them with risk management.
Yes. Many investors use fundamental analysis to find a business worth owning and technical analysis to time the entry and exit. This combination is the foundation of the first two of Andy Tanner’s Four Pillars of Investing.
It is most often used for longer-term decisions because a company’s value tends to show up over time, but it carries no guarantee. A company with healthy financials can still fall in price, which is why risk management matters.
The evidence is mixed. Some research finds that certain technical indicators carry useful information, while other research finds that individual investors who use technical analysis have underperformed. Training, discipline, and a plan to limit losses matter more than any single indicator.
Both. Andy Tanner teaches fundamental analysis and technical analysis as the first two of four pillars, alongside cash flow positioning and risk management.
Start with financial education. Learn the eight numbers on your own finances, read the financial statements of a company you understand, and practice reading simple price charts before putting real money at risk.