
The market isn’t driven by mystery
Most people learn about the stock market the hard way — by losing money they didn’t understand they were risking. A headline scares them out of a position. A rate announcement sends them to cash. A single earnings miss on a company they’ve held for years causes panic. All of these reactions share a common root: the investor didn’t understand why the market was moving. They saw price change without context.
The market is not driven by mystery. It is driven by a hierarchy of forces — some operating over decades, some over months, and some over days. The investor who understands this hierarchy can stop reacting to the wrong signals and start positioning for the right ones.
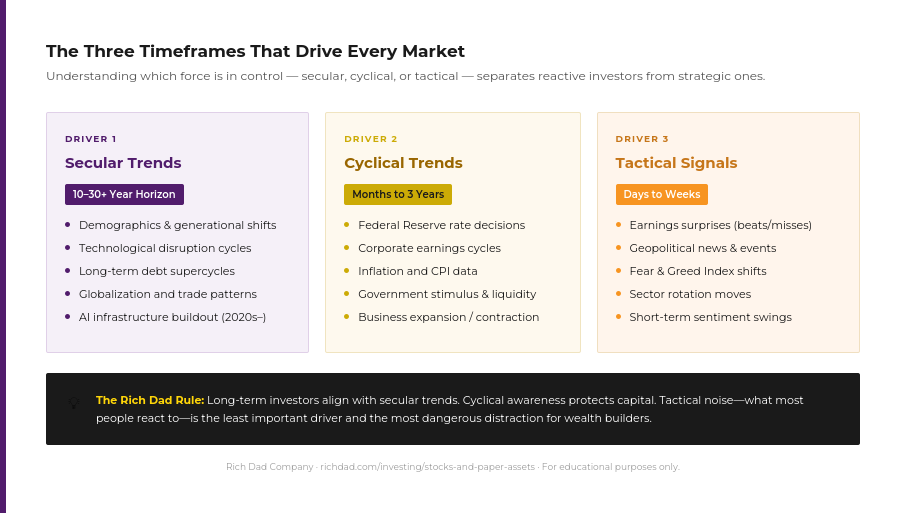
The three types of market drivers
Not all forces operate on the same clock. Paper assets advisor Andy Tanner — and the framework used by professional institutional investors — organizes market drivers into three distinct timeframes: secular, cyclical, and tactical. Each one requires a different kind of attention and a different investor response.
Secular trends: The 10-to-30-year forces
Secular trends are the tectonic plates of the market — slow-moving, enormous in scale, and nearly impossible to stop once in motion. They are driven by demographic shifts, generational behavioral patterns, long-term debt cycles, and structural technological change.
Two of the most powerful secular trends in modern financial history illustrate the concept clearly. The Baby Boomer generation flooding the U.S. workforce through the 1960s and 1970s created an extended era of high corporate earnings and labor market competition. When China joined the World Trade Organization in 2001, the resulting expansion in global trade reshuffled manufacturing, currency flows, and commodity pricing for the next two decades.

The secular trend that is shaping markets right now is the AI infrastructure buildout. The capital expenditure surge from major technology platforms investing in data centers, chips, and large language model development represents a structural allocation shift that is likely to influence market behavior for a decade or more — similar in scope to the internet infrastructure boom of the late 1990s, but with more immediate commercial revenue attached to it.
For long-term investors, secular trends define the terrain. They inform asset class selection and sector exposure over years, not months. Aligning a portfolio with the dominant secular trend is arguably the single highest-leverage decision an investor makes.
Cyclical trends: The months-to-years rhythms
Cyclical drivers operate within the secular environment and are powered by the business cycle — the rhythm of expansion and contraction that characterizes every economy. Policy decisions, liquidity injections, corporate earnings seasons, and credit conditions all fall into this category.
A clear example: in the immediate aftermath of the COVID-19 pandemic in 2020 and 2021, policymakers injected a historically unprecedented level of fiscal stimulus and monetary liquidity into the financial system. The Federal Reserve held interest rates near zero while the U.S. Treasury distributed trillions in direct economic support. That cyclical liquidity surge powered an 18-month bull run in equities — particularly in technology and e-commerce — that had little to do with long-term earnings fundamentals and everything to do with cheap money and a reopening economy.
Understanding cyclical trends helps investors calibrate when to be aggressive and when to be defensive. When the cycle is in expansion — rising earnings, accommodative monetary policy, healthy credit — the tailwind supports equity positions. When the cycle turns — credit tightening, earnings under pressure, the Fed hiking rates — the headwind requires a different posture.
Tactical signals: The days-to-weeks noise
Tactical drivers are the most visible and the most misused category of market information. These are the short-term catalysts — an earnings surprise, a geopolitical development, a Federal Reserve press conference statement, a better-than-expected jobs report — that move prices for hours, days, or weeks.
For short-term traders, tactical signals are the primary input. For long-term wealth builders, they are largely irrelevant as decision drivers, but dangerous if allowed to trigger emotional responses. A press story about a corporate scandal that causes a 20% single-day price drop on a fundamentally sound company is not a reason to sell — it may be a buying opportunity. Reading a tactical signal correctly requires knowing the secular and cyclical backdrop first.The market isn’t driven by mystery
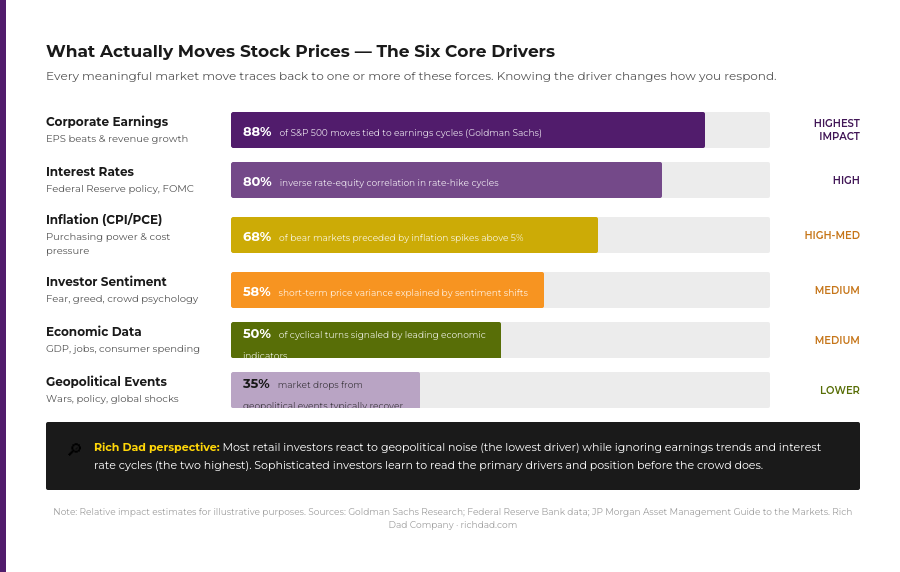
The six forces that actually move stock prices
Within the driver framework above, six specific forces account for the vast majority of meaningful stock market movement. Understanding each one — and how they interact — is the foundation of financial intelligence as it applies to paper assets.
Corporate earnings: The primary engine
Over the long term, nothing drives stock prices more reliably than corporate earnings. A company’s stock price is, at its core, the present value of all future cash flows discounted back to today. When earnings grow, that present value rises. When earnings contract, it falls.
Earnings drive markets at both the individual stock level and the index level. Each quarter, public companies report their results, and the gap between what analysts expected and what the company delivered — the earnings surprise — determines the immediate stock price reaction. A company that beats estimates by 10% may see its shares surge; one that misses by 5% may fall hard even if it reported a profitable quarter.
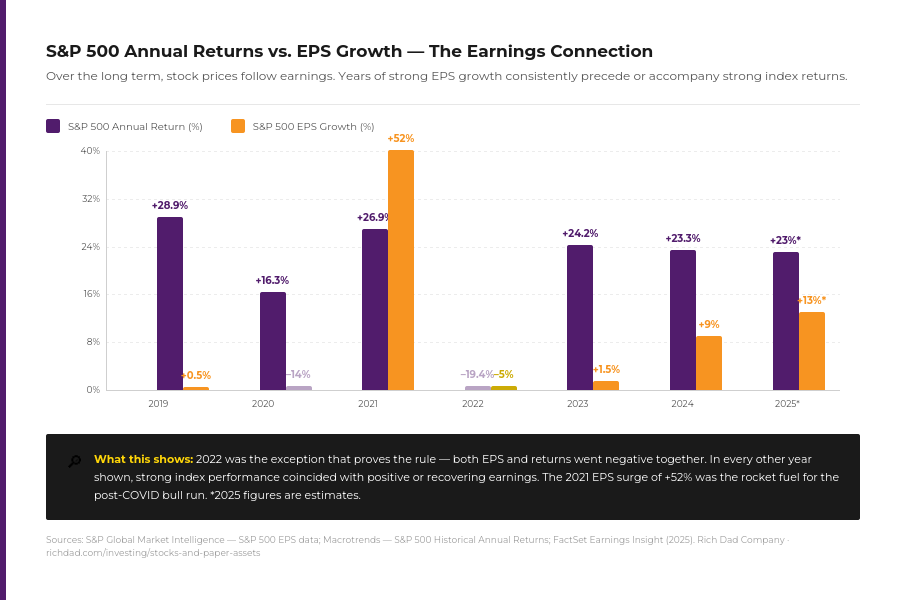
At the index level, aggregate S&P 500 earnings per share (EPS) growth is one of the strongest predictors of long-term market direction. The 2021 bull run was powered by a +52% EPS rebound from the pandemic trough. The 2022 bear market coincided with earnings contraction. The subsequent recovery in 2023 and 2024 tracked closely with earnings expansion resuming.
This is why Andy emphasizes fundamental analysis as one of the four pillars of stock market investing — understanding the earnings trajectory of a company, its revenue model, and its competitive moat. These fundamentals eventually resolve to price, even if sentiment disconnects them temporarily.
Interest rates: The discount engine
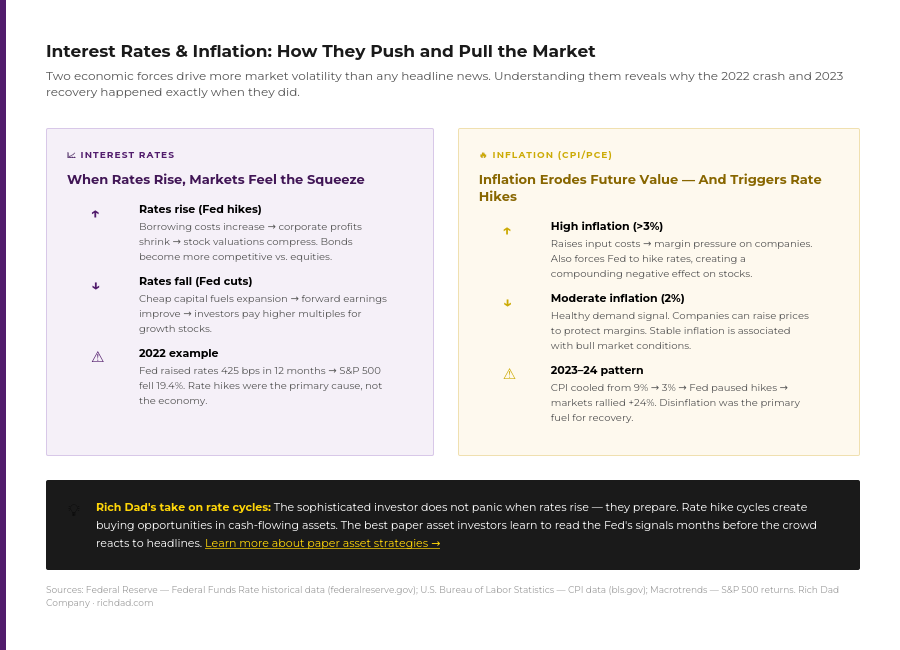
Interest rates are the lever the Federal Reserve uses to manage the economy — and their effect on equity markets is profound. When the Fed raises the federal funds rate, borrowing becomes more expensive across the entire economy. Companies pay more to service debt. Consumers finance less. Business investment slows. Profit margins compress.
The other mechanism is valuation. Stocks are priced using discounted cash flow models, and the interest rate is a core input in the discount rate. When rates rise, the present value of a company’s future earnings declines mathematically — which means the stock should be worth less, even if the business has not changed at all. This is why growth stocks (whose value is heavily weighted toward future earnings) fall harder in rate-hike cycles than value stocks or dividend payers.
The 2022 experience is the cleanest modern case study: the Fed raised rates by 425 basis points in a single calendar year — the most aggressive tightening cycle in four decades. The S&P 500 fell 19.4%. The Nasdaq, dominated by growth-weighted tech companies, fell over 33%. The cause was not economic collapse. The cause was the math of rising discount rates applied to elevated valuations.
Inflation: The silent erosion and rate trigger
Inflation operates on the market through two channels: directly and via the Federal Reserve’s response to it. Directly, inflation raises the cost of inputs — raw materials, wages, energy — which compresses corporate profit margins if companies cannot pass those costs to customers quickly enough. Indirectly, inflation forces the Fed to raise interest rates, which then triggers all the valuation compression mechanics described above.
The Federal Reserve’s dual mandate is price stability and maximum employment. When inflation runs above its 2% target, the Fed is obligated to act. This is why a CPI reading that comes in above expectations can send equity markets lower almost immediately — investors are not reacting to the inflation data itself, they are anticipating what the Fed will do next.
Moderate inflation — around 2% — is actually associated with healthy bull market conditions. It signals demand, which supports earnings. The danger zone is sustained inflation above 4–5%, which forces the hand of monetary policy in ways that reliably create market turbulence. The 2022 inflation spike to 9.1% — a 40-year high — was the single most important factor in that year’s market decline.
Investor sentiment: The market’s emotional temperature
Markets are not driven by spreadsheets alone— they are driven by human beings making decisions. And human beings are ruled by fear and greed. Investor sentiment is the collective emotional state of the market at any given moment, and it can override fundamentals in the short term.
The Fear & Greed Index, the VIX volatility index, put/call ratios, and AAII investor surveys are all attempts to quantify this sentiment. When sentiment becomes extremely fearful — as it did in March 2020 and again in October 2022 — assets are often priced well below their fundamental value. When sentiment reaches extreme greed — as it did in late 2021 — assets may be priced above any reasonable fundamental justification.
Robert Kiyosaki has long described the market psychology of the crowd as the primary mechanism by which wealth transfers from the uninformed to the informed. The investor who understands that fear creates buying opportunities and greed creates selling signals has a fundamental advantage over the investor who simply follows the crowd’s emotional temperature. This is one of the core mindset distinctions between the poor dad and rich dad approaches to investing.
Economic data: GDP, employment, and consumer spending
The macroeconomic backdrop provides the operating environment in which companies earn (or don’t earn) their profits. Key data releases — GDP growth rates, unemployment reports, consumer confidence surveys, retail sales figures, and manufacturing indexes — all signal the health of the overall economy, which directly affects corporate earnings capacity.
A strong jobs report can be a double-edged sword for markets: it signals economic health, but it may also mean the Fed has less reason to cut rates. This is why investors have been known to cheer “bad” economic news in rate-cutting environments — a weaker-than-expected jobs report can increase the probability of a Fed rate cut, which markets price in immediately.
Geopolitical events: The wild card
Geopolitical disruptions — wars, trade conflicts, sanctions, political instability, and major policy shifts — can trigger sharp short-term market moves. The initial shock of Russia’s invasion of Ukraine in 2022 sent European energy markets into turmoil. Trade tariff announcements in 2025 caused a significant Nasdaq correction of more than 21% at its lowest point before the market recovered.
The data, however, consistently shows that geopolitical-driven market drops tend to recover within 6 to 12 months unless they are accompanied by a fundamental change in earnings or monetary policy. A sophisticated investor recognizes the geopolitical event as a potential tactical signal — not a secular or cyclical one — and responds accordingly.
How to use the market driver framework as an investor
The three-driver, six-force framework is not academic theory — it is the basis of a repeatable investment process. Here is how to apply it at each stage of investment decision-making.
Step 1: Identify the dominant secular trend
Before evaluating any individual investment, ask: what is the dominant secular trend in this sector or asset class? Is it in a long-term growth phase driven by demographics, technology, or structural economic change? Or is it in secular decline — like physical retail, or certain legacy energy categories? Aligning with secular tailwinds dramatically increases the probability of a favorable outcome over any multi-year holding period.
Step 2: Read the cyclical environment
The cyclical environment determines your posture. In a cyclical expansion — falling rates, rising earnings, accommodative credit — a more aggressive posture may be warranted. In a cyclical contraction — rising rates, earnings pressure, tightening credit — a more defensive posture protects capital. The CASHFLOW Quadrant concept applies here: investors on the right side of the quadrant (B and I) are not dependent on a single cyclical outcome. They own assets that generate income regardless of which direction rates move.
Step 3: Watch tactical signals for entry and exit points

Once secular and cyclical alignment is established, tactical signals can be used to time entries and exits more efficiently. A company that is aligned with a secular growth trend, in a favorable cyclical environment, trading down on short-term negative sentiment offers a much higher probability setup than a company being purchased simply because a news story made it sound attractive. The tactical signal (the dip) is only meaningful in the context of the larger drivers.
Step 4: Apply the five investment filter questions
Rich Dad’s five investment filter questions are a practical overlay for any potential investment:
- Is this inside my circle of knowledge?
- Does it generate cash flow?
- What are the tax advantages?
- What is the real risk — and can I control it?
- Do I have the right team?
These questions force the investor to evaluate a potential position through a framework rather than an impulse. They apply as much to paper assets as they do to real estate or business investments.
Enhancing the standard market education
Most mainstream financial education stops at market mechanics — explaining what drives the market without connecting it to a larger philosophy of wealth building. Rich Dad’s contribution is to embed market knowledge within a broader framework that addresses income type, tax strategy, and the difference between paper assets and other asset classes.
The three types of income — earned, portfolio, and passive — are taxed differently and generated differently. The stock market, in the conventional 401(k)-and-index-fund approach, primarily generates portfolio income: dividends and capital gains. Robert and Andy both argue that this is a limited application of paper assets. Sophisticated paper asset investors can generate cash flow from stocks through options strategies — specifically covered calls and cash-secured puts — in ways that produce passive-income-like returns from a portfolio that most people hold purely for appreciation.
Understanding the market drivers covered in this article is prerequisite knowledge for any options strategy. A covered call position on a company in a favorable cyclical environment with strong earnings growth is a fundamentally different risk profile than the same position placed with no awareness of the macro backdrop. The driver framework protects the paper asset investor from making technically sound trades in fundamentally unsound environments.
Understanding drivers gives a fundamental advantage
The stock market will always produce volatility, sentiment swings, and tactical noise. That will never change. What can change is the investor’s relationship to those fluctuations. An investor who understands secular trends, cyclical environments, and tactical signals can observe market turbulence as information rather than threat — and act accordingly.
A true, working financial education philosophy begins with a simple premise: the right knowledge makes the right action possible. For paper asset investors, the right knowledge starts here — with the forces that actually drive the market — and extends through the fundamentals of analysis, options strategies, risk management, and cash flow investing across asset classes.
The market is not a force to fear. It is a system to understand. And every investor who commits to that understanding is one step closer to the financial freedom that Robert has spent three decades teaching the world is possible.
FAQs
Corporate earnings growth is the most consistent long-term driver of stock market performance. Over extended periods, index prices closely track the trajectory of aggregate earnings per share. Interest rates and investor sentiment can create short-term disconnects, but earnings growth is the ultimate anchor of equity value.
When interest rates fall, two things happen simultaneously: borrowing costs for companies decrease (which supports profit growth), and the discount rate used to value future earnings also falls (which increases the present value of those earnings). Both effects push stock prices higher. Lower rates also make bonds and savings accounts less attractive, which redirects capital toward equities.
Inflation affects the stock market through two primary channels. First, it raises input costs for businesses — wages, raw materials, energy — which compresses profit margins. Second, inflation typically prompts the Federal Reserve to raise interest rates, which then reduces stock valuations through higher discount rates. Moderate inflation of around 2% is generally associated with healthy market conditions. Inflation above 5% has historically been a reliable precursor to market stress.
A secular trend is a long-term force that operates over decades — driven by demographics, major technological change, or structural economic shifts. A cyclical trend operates over months to a few years and is tied to the business cycle, monetary policy, and liquidity conditions. Understanding which type of trend is dominant helps investors calibrate their time horizon and risk posture appropriately.
The appropriate response depends on what is driving the drop. If the decline is driven by tactical sentiment (a news event, short-term fear) against a backdrop of intact secular and cyclical fundamentals, it may represent a buying opportunity. If the drop is being driven by a genuine cyclical deterioration — tightening credit, earnings contraction, rising rates — a more defensive posture may be warranted. Rich Dad’s framework recommends always identifying the driver before taking action.
Investor sentiment is the collective emotional state of market participants at any given time. When sentiment is extremely fearful, assets often sell off below their fundamental value, creating buying opportunities for informed investors. When sentiment reaches extreme greed, assets can trade above any reasonable fundamental justification. Sentiment is the primary driver of short-term price volatility but tends to revert to fundamentals over time.